Website uptime monitoring, explained simply
What uptime actually means, how it's measured, and why "99.9%" hides more downtime than you'd think.
"Uptime" gets thrown around in marketing copy like it's a single number that tells you everything. It isn't. Understanding what uptime really measures — and what it quietly leaves out — helps you read status pages and SLAs without being misled.
What uptime actually is
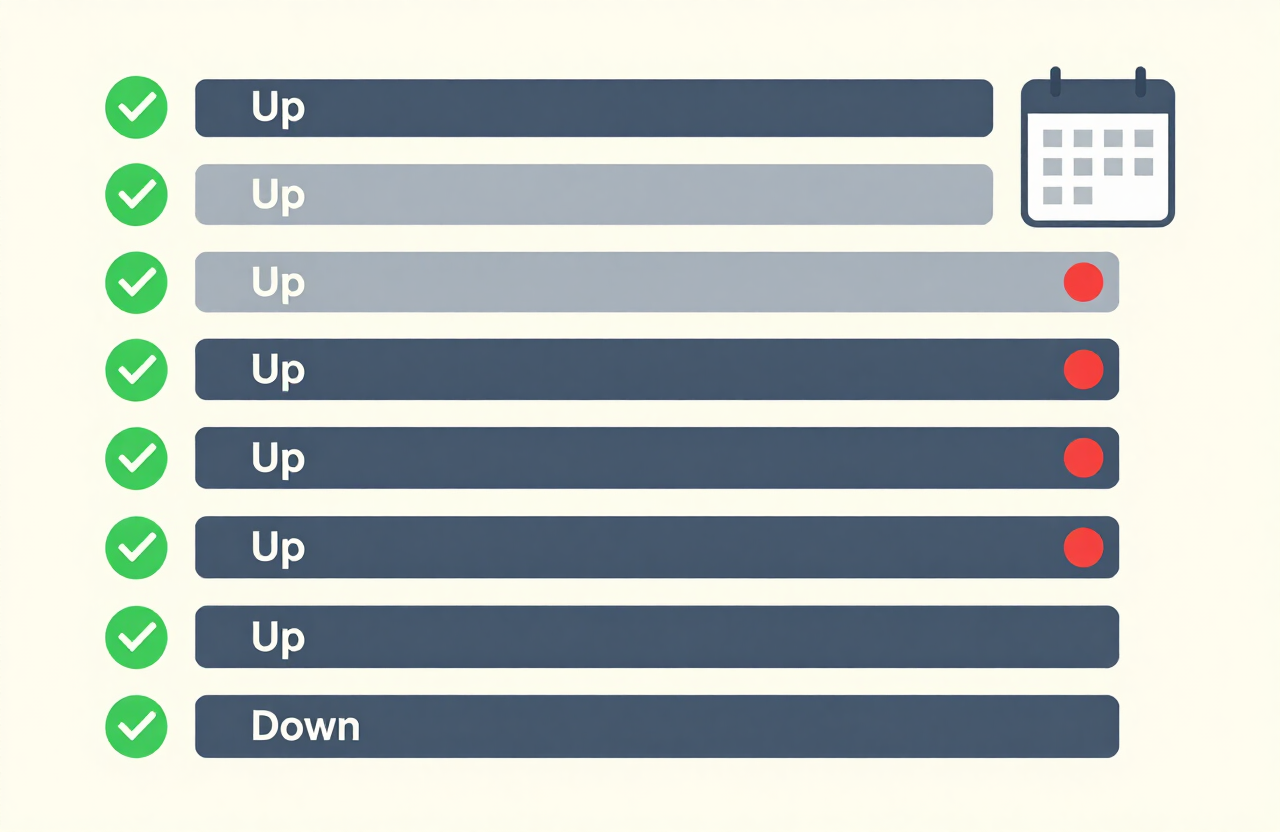
Uptime is the percentage of time a service was reachable and responding correctly over a given window. It's measured by repeatedly making requests to the service and recording whether each one succeeded. The ratio of successful checks to total checks, expressed as a percentage, is your uptime figure.
Why 99.9% isn't as good as it sounds
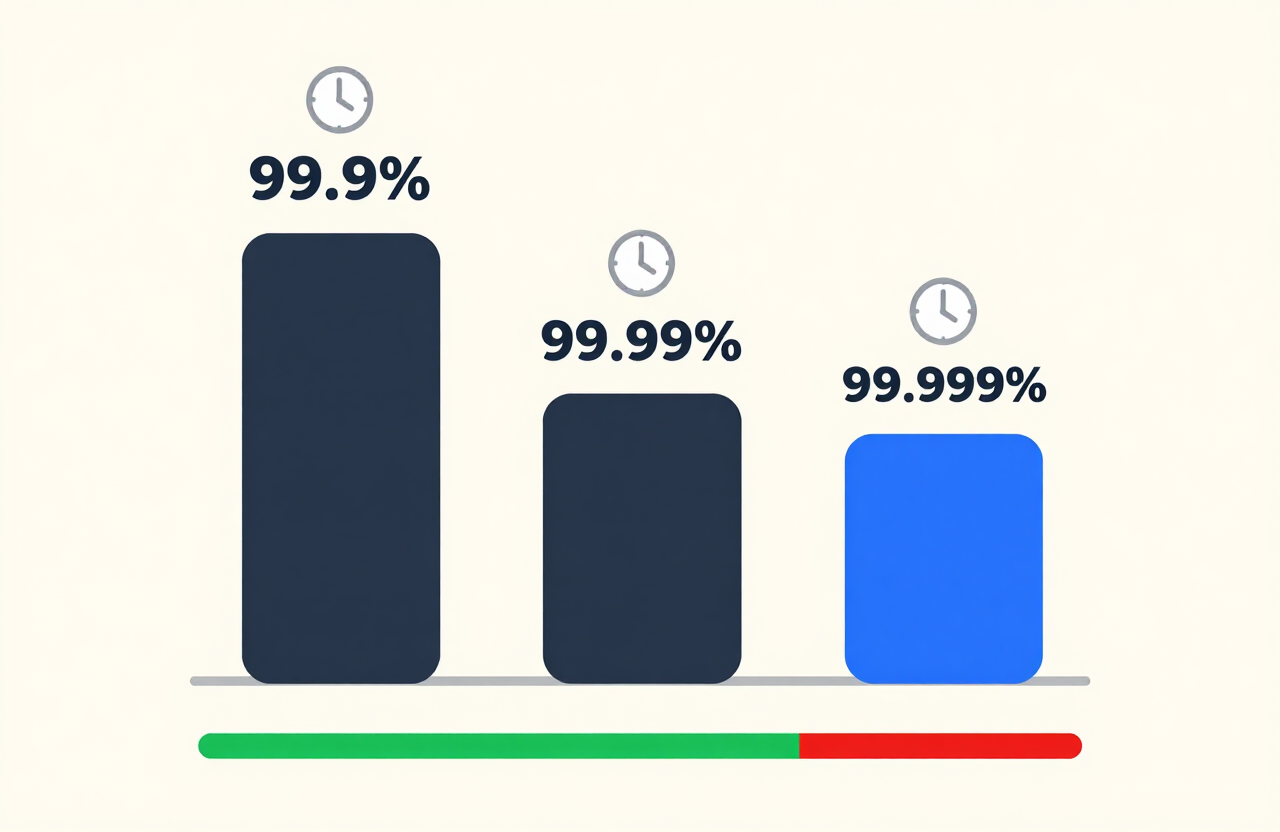
Three nines — 99.9% — sounds impressive until you do the math. Over a year, 99.9% uptime allows for about 8 hours and 45 minutes of downtime. 99.99% ("four nines") drops that to roughly 52 minutes. 99.999% ("five nines") is about 5 minutes a year — and is genuinely hard to achieve. When a provider quotes an uptime number, always ask: over what window, and what counts as "down"?
What gets excluded
Most SLAs exclude scheduled maintenance windows, force-majeure events, and problems caused by the customer's own code or configuration. That means the headline number can look great while real users still experience outages. The exclusions are usually fair, but they're worth knowing when you compare two providers.
Check frequency matters
If you only check once an hour, a 5-minute outage might fall entirely between two checks and never get recorded — your uptime log will show 100% even though real users were affected. Shorter intervals catch more, but cost more. For most sites, checking every 1–5 minutes is a reasonable balance.
How to use this site for lightweight monitoring
CheckItsDown is built for on-demand checks rather than continuous monitoring, but the per-site history page gives you a quick read on recent reliability. Bookmark a site's page, hit "Check again" periodically, and watch the history list — a string of ups with the occasional down tells a very different story than a wall of red.